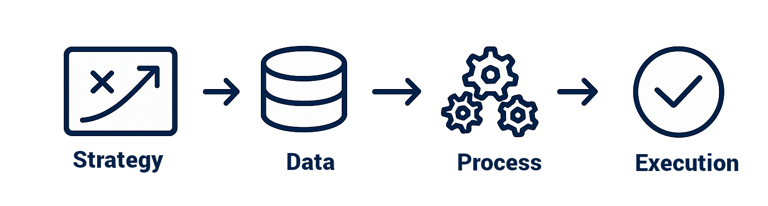
Transform Your Processes with Real-Time Insights

Unlock efficiency and drive performance with our advanced process mining platform powered by AI.

About Rithems

Empowering businesses with innovative SaaS solutions for process mining and real-time analytics.

A web page screenshot displaying a user interface with a dark background and purple and white text. The main heading reads 'Design workflows #withMake' and offers services related to designing, building, and automating workflows. The interface includes navigation options such as Apps & services, Templates, and Pricing.
A computer screen displaying analytics dashboards with various charts, including a line graph on the left and a cohort analysis table on the right. The table is populated with different shades of blue, indicating varying levels of user activity over several weeks. Text labels and numbers detail user retention statistics.

Process Optimization Solutions

Unlock efficiency with our advanced analytics and AI-driven process mining platform for businesses.

Real-Time Insights
A digital screen displaying analytical data with line graphs, histograms, and numerical values. The data is presented in a user-friendly interface with different shades of blue used to distinguish various elements.

Discover inefficiencies and bottlenecks with our cutting-edge process discovery tools.

A computer screen displaying a data analytics dashboard with graphs and charts. A blue line graph shows fluctuations in data over time, and a section highlights the number of page views. A pie chart is partially visible, indicating a breakdown of different data elements.
A web page featuring a promotional message about creating mobile apps from data. The headline text emphasizes transforming data into beautiful, powerful mobile applications. Below the headline, there is an image of a smartphone interface displaying app previews with a toolbar and menu options. The user interface is sleek and modern with a soft pastel background gradient.
Advanced Analytics

Leverage data-driven insights to enhance performance and reduce hidden costs in your operations.

Seamless Integration

Integrate effortlessly with existing systems using our robust APIs for enhanced functionality.

Customer Reviews

See what our clients say about our innovative SaaS solutions.

Rithems transformed our processes, revealing inefficiencies we never noticed before. Highly recommend!

Alex Johnson
A digital dashboard displaying various analytics charts and graphs. There is a line graph showing user engagement over time on the left, a section with total revenue marked as $74K, and bar charts illustrating user statistics by region. The central section highlights users in the last 30 minutes, focusing on different countries such as the United States, Canada, India, Pakistan, and Brazil.

New York

The advanced analytics provided by Rithems have significantly improved our operational efficiency. Their platform is a game changer for our business!

A large mining site is spread across a vast landscape with multiple heavy machinery and trucks in operation. The site has a variety of soil and rock formations, with visible conveyor belts and excavators working. The background features green hills and a partly cloudy sky.
Maria Smith

San Francisco

★★★★★
★★★★★

Gallery

A laptop with an open screen displaying dashboard analytics featuring charts, graphs, and numerical data related to sales and subscriptions. The interface is predominantly dark-themed with sections highlighting key performance metrics. The device shown is a MacBook Pro, indicated by the keyboard layout and branding.
A computer screen displaying an analytics dashboard with metrics such as event activity, showing a current value of 4.7k for today's activity. There are graphs indicating trends and peaks in the data, as well as labels for different types of events.
A laptop on a wooden desk displays a web application interface featuring graphs and statistics. Beside it, a large monitor shows a webpage promoting an all-in-one meeting app. A cup with a recognizable green and white logo sits on the desk.
An abstract, pastel-colored, 3D-rendered representation of data analysis and search engine optimization (SEO). The image features a computer interface with various analytics symbols, including a magnifying glass, bar charts, pie charts, and a search bar with the text 'SEO'. Surrounding the interface are different objects such as a potted plant, a cup with a saucer, and a megaphone, all placed on a light green background.
Aerial view of a large industrial mining operation with massive excavators cutting through layers of earth and rock. The landscape is marked by deep ridges and patterns created by machinery, with heaps of excavated material forming a stark contrast against the machinery's metal structures.
Heavy machinery operates on a large-scale mining site. Excavators and dump trucks are moving earth and materials, surrounded by rocky terrain and steep slopes. The equipment is primarily yellow and orange, indicating industrial use, and work is being actively carried out to extract resources.

Explore our innovative solutions for process optimization and discovery.